Harshith Bachimanchi
Presentation at Marine Microbial Chemical Communication (M2C2) webinar series
(online) at Weizmann institute of science, Israel
5 May 2021, 15:45 CEST
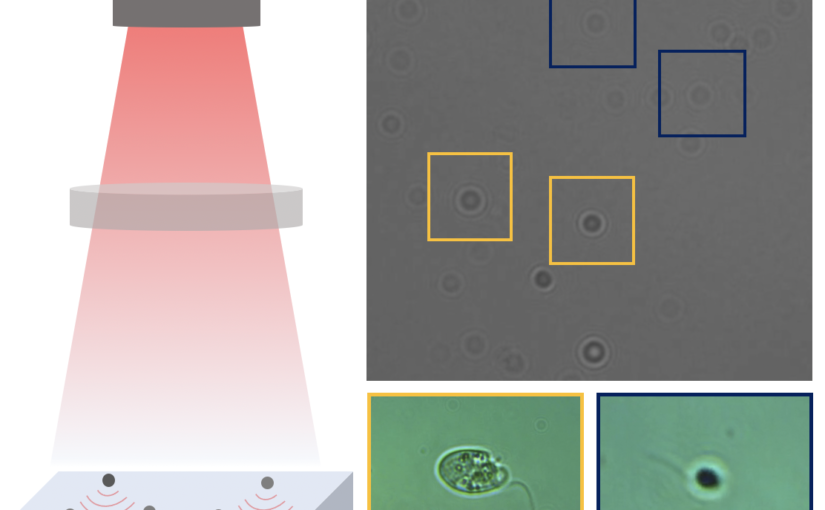
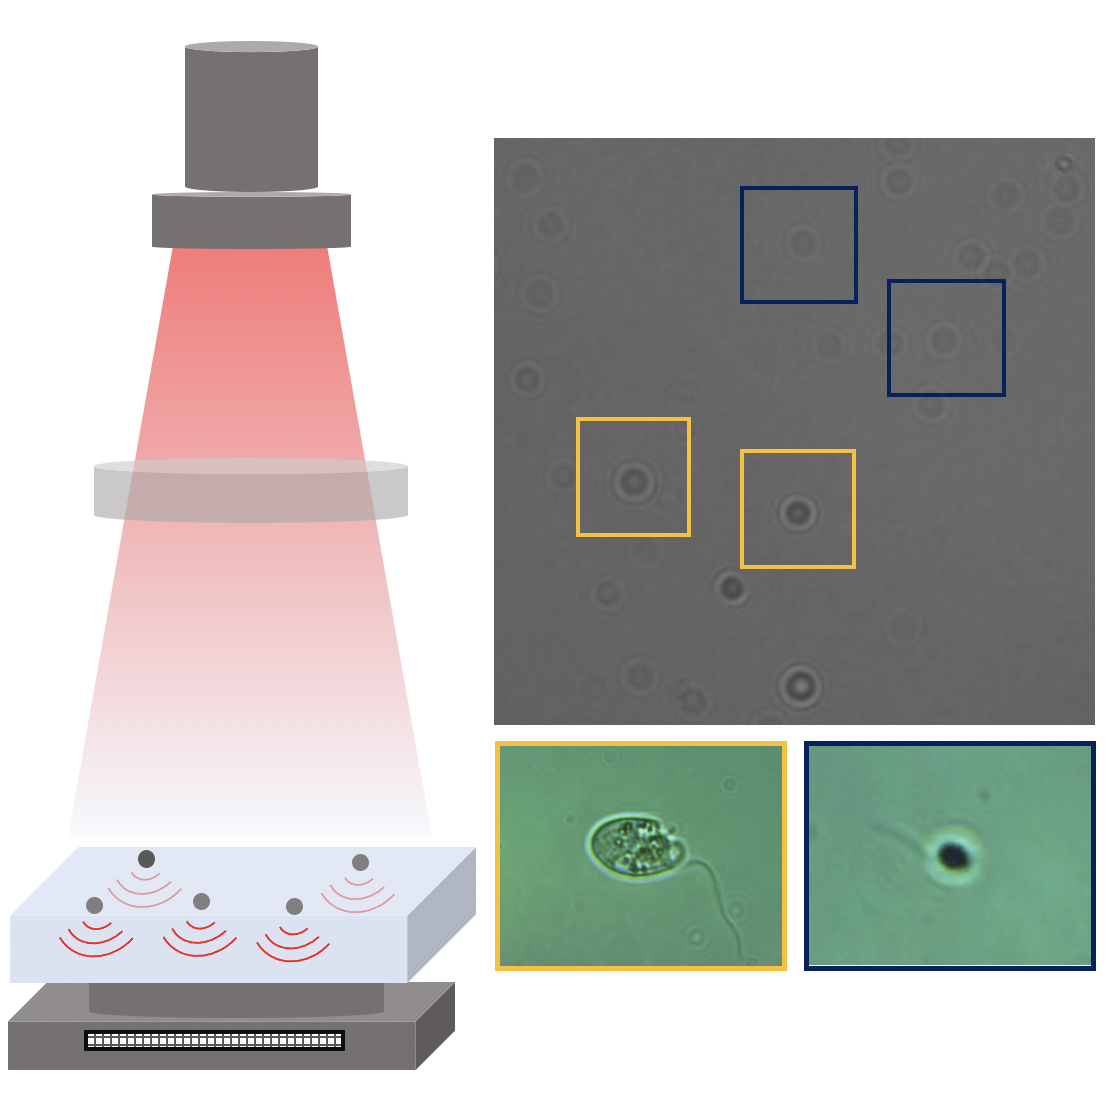
Phytoplankton and zooplankton are the foundation of the marine food chain. Being an autotrophic primary producer, phytoplankton can generate their own source of energy through photosynthesis. During this process, phytoplankton populations all over the world absorb about 65 Gt (gigatons) of carbon from the atmosphere and thereby equivalently produce the largest amount of oxygen on the earth. The main consumers of this absorbed carbon are the heterotrophic microzooplankton, occupying the next level in the hierarchy of the marine food chain, consuming about two-thirds of the total production (39 Gt). This is likely the largest transition of biological carbon on Earth. Despite being fundamental for our understanding of the carbon cycle and the earth’s climate, the standard estimates leave many questions unanswered at a single microplankton level. Here, we demonstrate that machine learning can be used to estimate the amount of carbon consumed at a single plankton level. We use digital holographic microscopy powered by deep learning to classify planktons by their species and track the biomass of the plankton during individual feeding events. We use the planktonic species, Dunaliella tertiolecta, and Oxyrrhis marina, for our experiments which belong to classes of phytoplankton and microzooplankton respectively. With the help of artificial neural networks, we manage to estimate the carbon consumption and native carbon content at an individual microzooplankton level. Furthermore, we demonstrate the advantages of the approach and compare the results with standard ensemble estimates.